In the era of data analysis courses, one of the most important conception every seeking analyst must know is Standard Deviation. Either you’re doing a free data analyst course or a specialized course in data analyst, knowing how to calculate and interpret standard deviation is vital.
At Statistics Solutions, we offer both free data analytics courses and specialized data analyst classes that impart notions like standard deviation in the easiest, most practical way—especially using tools like IBM SPSS and SPSS software.
What is Standard Deviation?
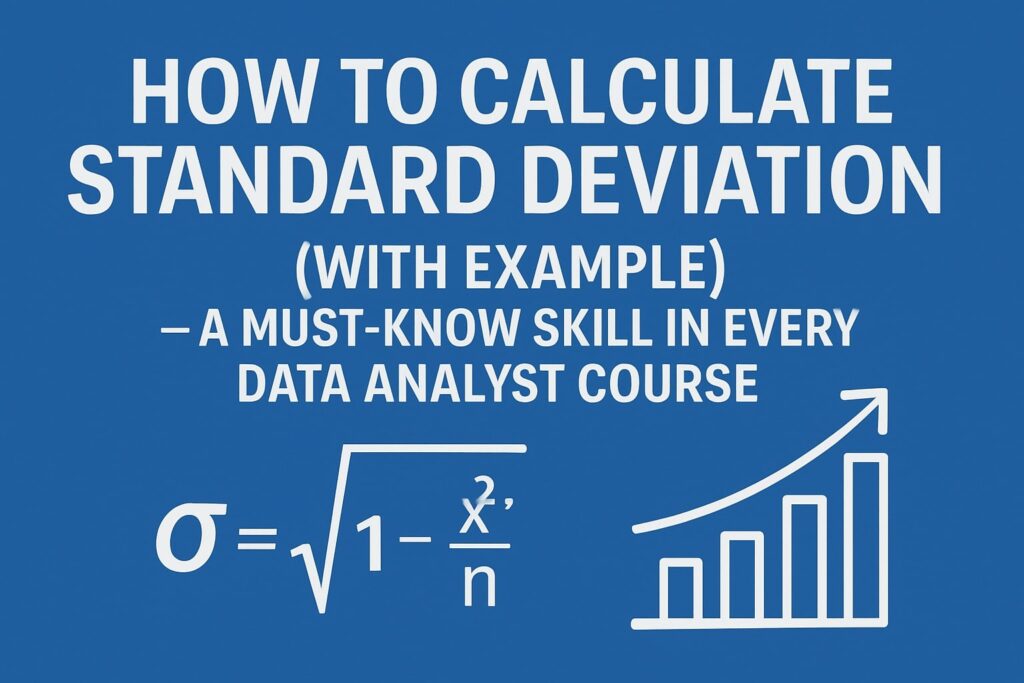
Standard deviation is also called the root mean square deviation. It shows dispersion of data points from the mean. In simple terms, it shows variability of a data.
Formula for Standard Deviation
Where:
xi= Value of individual observation
µ = Mean of observations
N= Number of observations
This formula is explained in our data analysis free course and demonstrated using ibmspss tools.
Step-by-Step: Standard Deviation Example
- Steps to calculate Standard Deviation:
- Calculate mean (x̄) of all values (x).
- Find deviation of each from mean, that is, (x-x̄)
- Find sqaure of (x-x) i.e. (x-x̄)2.
- Find the sum of all squares [Ʃ(x-x̄)2].
- Divide sum by number of participants and take square root to get standard deviation
Standard Deviation = [(Ʃ(x-x̄)2)/n]
- Example 1: Let’s calculate the Standard Deviation of height of 6 participants from the following data:
Table 3.13: Data for Example 1
|
S. No. |
Height (cm) (x) |
|
1 |
120.1 |
|
2 |
122.8 |
|
3 |
135 |
|
4 |
150.6 |
|
5 |
155.2 |
|
6 |
128.3 |
|
Mean (x̄) = 135.3 |
To calculate standard deviation, first step is to calculate mean. Mean of the above data came out to be 135.3. Now the next step is to calculate deviation of mean from each value. For this, mean will be subtracted from each value, as follows:
|
S. No. |
Height (cm) (x) |
Deviation from mean (x- x̄) |
|
1 |
120.1 |
120.1-135.3 = -15.2 |
|
2 |
122.8 |
122.8-135.3 = -12.5 |
|
3 |
135 |
135-135.3 = -0.3 |
|
4 |
150.6 |
150.6-135.3 = 15.3 |
|
5 |
155.2 |
155.2-135.3 = 19.9 |
|
6 |
128.3 |
128.3-135.3 = -7 |
|
Mean (x̄) = 135.3 |
Once all deviations are calculated, amongst which some values are negative, we need to square all deviations [(x- x̄)2], as follows:
|
S. No. |
Height (cm) (x) |
Deviation from mean (x- x̄) |
Square of deviation (x- x̄)2 |
|
1 |
120.1 |
120.1-135.3 = -15.2 |
(15.2)2 =231.4 |
|
2 |
122.8 |
122.8-135.3 = -12.5 |
(12.5)2 = 156.25 |
|
3 |
135 |
135-135.3 = -0.3 |
(0.3)2 = 0 .09 |
|
4 |
150.6 |
150.6-135.3 = 15.3 |
(15.3)2 = 234.09 |
|
5 |
155.2 |
155.2-135.3 = 19.9 |
(19.9)2 = 396.01 |
|
6 |
128.3 |
128.3-135.3 = -7 |
(7)2 =49 |
|
Mean (x̄) = 135.3 |
After calculating square of deviation for each observation, last step is to calculate standard deviation. Standard deviation is calculated by calculating mean of all square of deviations (Add up all absolute deviations and divide by number of observations) and taking a square root of that mean, as follows:
|
S. No. |
Height (cm) (x) |
Deviation from mean (x- x̄) |
Square of deviation (x- x̄)2 |
Standard Deviation √ Ʃ (x- x̄)2/n |
|
1 |
120.1 |
120.1-135.3 = -15.2 |
(15.2)2 =231.4 |
√(231.4+156.25 +0.09+234.09+396.01+49)/6 = √1066.84/6 = √177.81 = 13.3 |
|
2 |
122.8 |
122.8-135.3 = -12.5 |
(12.5)2 = 156.25 |
|
|
3 |
135 |
135-135.3 = -0.3 |
(0.3)2 = 0 .09 |
|
|
4 |
150.6 |
150.6-135.3 = 15.3 |
(15.3)2 = 234.09 |
|
|
5 |
155.2 |
155.2-135.3 = 19.9 |
(19.9)2 = 396.01 |
|
|
6 |
128.3 |
128.3-135.3 = -7 |
(7)2 =49 |
|
|
Mean (x̄) = 135.3 |
So 13.3 is the standard deviation in above example.
We walk you through this process with real-life datasets in our data analyst classes, using SPSS soft ware for quicker computation and better visualization.
Learn Standard Deviation & More with Free Courses
At Statistics Solutions, we provide:
✅ Free data analytics training
✅ Hands-on experience with ibmspss
✅ Practical examples in every course data analyst
✅ Downloadable resources and eBooks
✅ Lifetime access to your free data analyst course
Whether you’re just exploring a free course for data analytics or want to advance in a structured course in data analyst, our platform supports learners at every level.
Who Can Benefit from This?
Our data analysis courses are ideal for:
- Students pursuing a career in research
- Professionals looking to upskill with a data analyst course free
- Educators seeking easy-to-teach resources
- Researchers using ibmspss and SPSS soft ware
You can choose from self-paced data analysis free course modules or enroll in certified programs with instructor support.
Start Learning Today
Don’t just learn the theory—apply it! With our free data analytics courses, you can master concepts like standard deviation, regression, and hypothesis testing using real-world data.
Visit https://statsresearchcourses.com/courses/ and explore our data analyst course, including data analyst course free options, expert-led sessions, and free data analytics training that fits your schedule.
Buy Ebooks Online -
-
Books
RESULT TABLES PREPARATION: NOW NO MORE STRUGGLE (A E-BOOK)
Rated 0 out of 5₹799.00Original price was: ₹799.00.₹399.00Current price is: ₹399.00. Add to cart -
Books
SIMPLIFYING STATISTICS: A COMPLETE KNOWHOW OF STATISTICS COURSEWORK FOR RESEARCH (AN E-BOOK)
Rated 0 out of 5₹1,399.00Original price was: ₹1,399.00.₹899.00Current price is: ₹899.00. Add to cart -
Books
TESTS OF SIGNIFICANCE: A COMPLETE INSIGHT INTO BIVARIATE ANALYSIS (AN E-BOOK)
Rated 0 out of 5₹899.00Original price was: ₹899.00.₹499.00Current price is: ₹499.00. Add to cart -
Books
MULTIVARIATE ANALYSIS – GET RID OF THE ANOVA AND REGRESSION FEAR (An E-book)
Rated 0 out of 5₹899.00Original price was: ₹899.00.₹499.00Current price is: ₹499.00. Add to cart -
Books
BASIC STATISTICS-AN EASY AND COMPREHENSIVE GUIDE (An E-book)
Rated 0 out of 5₹799.00Original price was: ₹799.00.₹399.00Current price is: ₹399.00. Add to cart

